Learn the specific Turnitin similarity report colors meaning to interpret your score. Understand the color chart, AI indicators, and how to cite sources.
Comprehensive Analysis of Turnitin Similarity Report Colors and AI Detection Systems
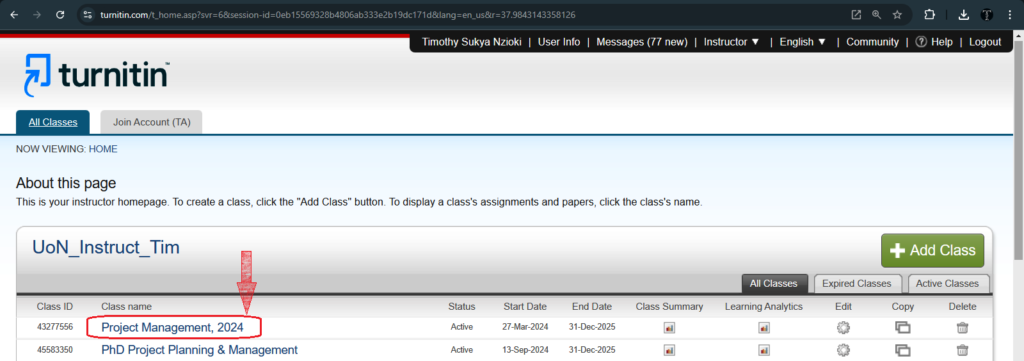
The academic community relies on text comparative tools to maintain the integrity of student submissions and published research. Turnitin serves as the most prominent platform for this purpose, offering a suite of tools that compare a document against an massive database of web pages, student papers, and scholarly publications. The centerpiece of this system is the similarity report, which provides a numerical value and a corresponding color code to help users identify the volume of matching text. Understanding the Turnitin similarity report colors meaning is necessary for any student or instructor who needs to distinguish between legitimate research and potential academic misconduct. This analysis provides an exhaustive breakdown of the color chart, the underlying detection mechanisms, and the evolving role of artificial intelligence indicators in the academic review process.
The Architecture of the Turnitin Database and Comparison Logic
The effectiveness of any similarity check depends on the depth and breadth of the repository against which a document is measured. Turnitin maintains a multi layered database that covers three primary areas. First, the internet repository includes billions of current and archived web pages. If a student pulls text from a blog post that was deleted five years ago, the system can often still find it because it preserves archived content. Second, the student paper repository contains millions of documents submitted to the platform by students from institutions globally. This allows the system to identify collusion, which occurs when two or more students submit identical or highly similar work. Finally, the scholarly repository consists of thousands of periodicals, journals, and books that are typically behind paywalls but accessible to Turnitin through partnerships with publishers.
When you submit a file, the system breaks the text into small strings and searches for matches across these three repositories. The similarity score represents a mathematical ratio. It is the percentage of the submission that matches text found in the database, regardless of if the matching text is quoted or cited correctly. The calculation divides the total number of words in your submission by the amount of words matched to outside sources. This result generates a specific color based on the range of the percentage.
Detailed Interpretation of the Turnitin Similarity Color Chart
The Turnitin similarity color chart provides a visual triaging system for instructors. It allows them to quickly identify which papers require a closer look and which appear to be largely original. However, the color alone does not prove plagiarism. Plagiarism is an academic judgment made by a human detector; the software merely identifies similar text.
The Standard Similarity Score Color Chart Breakdown
The following table outlines the standard ranges and meanings for the color icons in most Turnitin integrations, such as Feedback Studio and Originality Check.
| Icon Color | Percentage Range | Technical Meaning of the Match |
| Blue | 0% | No matching text found in any repository. |
| Green | 1 Word to 24% | Insubstantial or minor matching text detected. |
| Yellow | 25% to 49% | Medium level of matching text overlap. |
| Orange | 50% to 74% | Medium to large volume of matching text. |
| Red | 75% to 100% | Very high volume of matching text detected. |
Each color requires a specific interpretation based on the context of the assignment. For instance, a blue originality report on Turnitin might seem like a perfect result, but it can sometimes raise questions. If a research paper is supposed to include heavy citations and a bibliography, a 0% score might indicate that the student has not used any external evidence. In other cases, it might suggest the student used technical tricks to hide matching text from the software.
Nuances of the Green and Yellow Ranges
A green score is generally common for papers that follow standard academic practices. Matches between 1% and 24% often come from a combination of properly cited quotes, common disciplinary phrases, and the bibliography. A green icon does not automatically clear a student of misconduct; a 5% match that is one continuous block of copied text from a single source is still plagiarism.
The yellow range (25% to 49%) signals a medium level of overlap. This is common in disciplines that require the use of specific, long legal statutes, scientific protocols, or extensive direct quotations from primary sources. When an instructor sees a yellow icon, they must determine if the matches are concentrated in the references or if the student has failed to paraphrase effectively.
Software Variations and the Similarity Score Turnitin Colors
The specific meaning of a color can change depending on which version of the software your institution has integrated into its learning management system. This is an important detail because a blue icon in one version might mean something different in another.
Comparing Feedback Studio and SimCheck Colors
Turnitin offers different products like Feedback Studio, Originality Check, and SimCheck. While the orange and red ranges remain consistent, the lower ranges (blue and green) are flipped in some versions.
| Range | Feedback Studio / Originality | SimCheck / Turnitin Similarity |
| 0% Match | Blue | Green |
| 1% to 24% Match | Green | Blue |
| 25% to 49% Match | Yellow | Yellow |
| 50% to 74% Match | Orange | Orange |
| 75% to 100% Match | Red | Red |
In the SimCheck interface, a green icon indicates that there is absolutely no matching text, while a blue icon represents matches up to 24%. You must check the specific number alongside the color to avoid misinterpretation based on these interface differences.
The Role of AI Writing Detection and Icon Meaning
Modern academic review includes the challenge of identifying content generated by large language models. Turnitin provides a separate indicator for this purpose. The Turnitin ai checker color meaning is distinct from the similarity score; these two metrics do not affect each other. A paper could have a blue similarity score (0% match) but a high AI probability.
Understanding the AI Writing Indicator Symbols
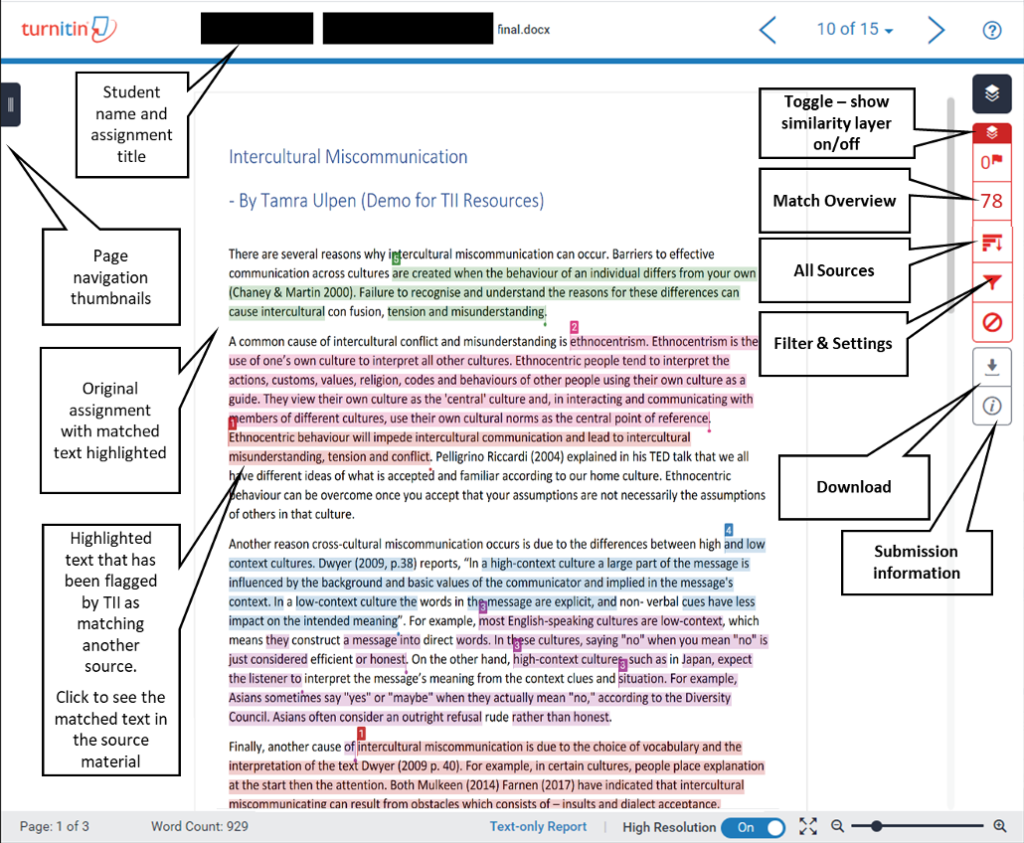
The AI detection tool uses a specific icon located in the right side panel of the similarity report. Its color tells you the status and reliability of the AI check.
| AI Icon Status | Meaning of the Indicator | Availability of Highlights |
| Blue Badge + % | Successfully processed; shows AI probability (20% to 100%). | Full interactive report available. |
| Blue + Asterisk (*%) | AI probability detected between 1% and 19%. | Highlights hidden for reliability. |
| Gray Icon (–) | The system could not process the file for AI. | No AI data produced. |
| Red Error (!) | A system error prevented processing. | Manual review or resubmission required. |
The blue indicator with a percentage means the system has identified specific parts of the text that follow the patterns of AI generated content. The asterisk symbol is a safeguard. If the system detects a low probability of AI (1% to 19%), it removes the specific number and the highlights because false positives are more likely in this range. This prevents instructors from making accusations based on less reliable data.
Interpreting Cyan and Purple Highlights in the AI Report
If you open the full AI Writing Report, the text is highlighted to show the type of AI influence detected.
- Cyan (Light Blue) Highlights: These areas mark text that the system identifies as being generated directly by an AI model like ChatGPT.
- Purple Highlights: These areas identify text that was likely generated by AI and then modified by an AI paraphrasing tool like QuillBot. The system looks for the underlying structure of the AI logic even if the specific words have changed.
Using Filters to Refine the Turnitin Color Chart Meaning
The raw similarity score often includes matches that are not problematic. Instructors and students can use exclusion filters to get a more accurate view of the original content. When these filters are applied, the similarity score percentage updates, and the icon color may change accordingly.
The Impact of Bibliography and Quote Exclusions
Many assignments require a long list of references. Since these titles and citations appear in thousands of other papers, they will always trigger a match. By excluding the bibliography, an instructor can see if the core content of the essay is original. Similarly, excluding direct quotes allows the reviewer to see how much of the paper is the student’s own voice versus the voices of the sources they cited.
Excluding Small Matches for Accuracy
Small matches often consist of common phrases or names. For example, the name of the university or the title of the course will appear in every student submission. An instructor can exclude matches below a certain word count (typically 10 words) to clear these “noise” matches from the report. This ensures that the similarity score reflects substantial text overlap rather than incidental commonalities.
Discipline Specific Benchmarks and Expectations
There is no universal “safe” score on the similarity score color chart. The acceptable percentage depends heavily on the field of study.
Humanities and Social Sciences
In disciplines like English, History, or Philosophy, original interpretation and unique prose are the standard. A score in the high green or yellow range (20%+) might be viewed with suspicion if it is not heavily justified by long block quotes from historical texts. Instructors in these fields look for a cohesive authorial voice.
Sciences and Engineering
In STEM fields, students must use standardized terminology and describe experimental procedures that are consistent across the field. A chemistry lab report or a medical case study will naturally contain more matching text. A score of 30% or 40% (Yellow) might be perfectly acceptable in these contexts if the matches are focused on the methodology and technical terms.
Case Studies in Color Interpretation and Academic Integrity
To understand the Turnitin plagiarism checker color code, it helps to look at how specific behaviors manifest in the report.
The First Submitter vs. The Copyist
In cases of collusion, the system uses the standard repository to identify matches. If Student X submits a paper and then gives a copy to Student Y, Student X might have a low green score based on their original research. When Student Y submits the same paper later, they will receive a red icon with a 100% match to Student X’s paper. This helps instructors identify who the original author was and who copied the work.
Self Plagiarism and Drafts
A student who submits multiple drafts of the same paper to different assignments will trigger a 100% match. While the red icon looks alarming, the instructor can manually exclude the previous submission to see if the new draft has any new similarities to external sources. This is a common part of the feedback process in many writing courses.
The “All Sources” vs. “Match Overview” Panel
The similarity report offers two ways to look at data. The Match Overview provides a summary where each color in the document relates to one source. The All Sources view shows every single place where a match was found, even if it is a smaller overlap. A paper that looks fine in the overview might show a problematic pattern when you look at all sources, such as a student pulling sentences from twenty different Wikipedia pages to create a single paragraph.
Student Tools for Improving Academic Writing
Turnitin Draft Coach is a specific tool that helps students address issues before the final submission. It provides feedback while you are writing in Google Docs or Microsoft Word.
The Citations Check and Issue Badges
Draft Coach doesn’t just look for text matches; it checks the relationship between your in text citations and your bibliography. If you cite a source in the text but forget to include it in the reference list, the system flags it with a purple issue badge. This helps you fix formatting errors that could otherwise lead to a higher similarity score or a charge of accidental plagiarism.
Using the Grammar Guide
The Grammar Guide in Draft Coach helps you improve the mechanics of your writing. It categories errors into grammar, mechanics, and usage, providing explanations for why a change is suggested. While this does not affect your similarity score, it helps create more polished, original work that is less likely to rely on the “predictable” structures that AI detectors look for.
Technical Limitations of Similarity Detection
No software is perfect, and there are several types of content that the Turnitin similarity report colors meaning cannot account for.
- Non-Textual Matches: The system cannot detect similarities in images, graphs, or hand drawn diagrams.
- Unindexed Content: While the database is large, it cannot see content on the “dark web,” private social media accounts, or password protected scholarly sites that have not partnered with Turnitin.
- Translated Text: If a student takes a German journal article and translates it into English, the software will not always find the match unless the translated match feature is specifically turned on and supported for those languages.
- Mathematical Formulas: While the system recognizes some strings of numbers, it is primarily built for prose. Complex equations often do not trigger matches in the same way that paragraphs of text do.
Summary of Strategic Interpretation for Professionals
The similarity score and its associated color are tools for investigation, not a final verdict on student character. The Turnitin color chart provides a map of where a paper matches the database, but it is the responsibility of the human reviewer to determine if those matches are ethical.
For an instructor, a high score (Orange or Red) means you should look at the sources to see if the student has provided proper attribution or if they have simply replaced the author’s name with their own. For a student, a high score is a signal to review your paraphrasing and citation habits. Even a low score (Blue or Green) requires verification to ensure that you haven’t missed a citation for a fundamental idea, even if the wording is different.
The evolving landscape of AI detection adds another layer of complexity. As these tools become more sophisticated, the distinction between “similar” text and “unauthentic” text will become the primary focus of academic integrity. By understanding the data behind the colors, the academic community can use these tools to support learning and maintain the value of original research.
Strategic Guidelines for Reviewing the Similarity Report
When you open a similarity report, follow these steps to ensure a fair assessment:
- Verify the Software Version: Determine if you are looking at Feedback Studio or SimCheck, as the meaning of blue and green may be different.
- Examine the Distribution of Matches: Look for concentrated blocks of color. A yellow score caused by one long block of text is more serious than a yellow score caused by fifty small phrases.
- Check for Integrity Flags: Modern reports will flag “hidden text” or “replaced characters” where students try to trick the software. These flags are more important than the percentage itself.
- Compare Similarity and AI Scores: If a paper has a 0% similarity score but a 90% AI score, it suggests the student used a generative tool to produce “original” text that doesn’t exist in the database.
- Review the Match Quality: A match to a legitimate academic journal is different than a match to a student’s own previous paper or a common list of definitions on a website.
By applying these diagnostic steps, you move beyond the surface level color indicators and into a deep, evidence based review of academic work. This ensures that the similarity report remains a helpful part of the educational process rather than a source of stress or incorrect accusations.
The Turnitin similarity report colors meaning is a gateway to understanding the origin and authenticity of academic text. Whether you are a student striving for a blue originality report or an instructor managing a complex classroom, the goal is the same: the clear and honest communication of ideas. Use the color chart as a starting point, but always rely on the detailed evidence provided in the full report to make your final decisions.
The logic of text matching will continue to change as search algorithms improve and as the database expands. The most effective way to manage your similarity score is to focus on high quality research habits: read the source material, put the source away, write your interpretation in your own words, and then provide a clear, accurate citation. If you follow these steps, the colors in your report will simply reflect the research you have done to support your own original arguments.
Conclusion on the Evolution of Academic Integrity Tools
As we look toward the future of academic writing, the integration of similarity and AI detection will become seamless. The current distinction between the similarity score and the AI writing indicator might eventually merge into a single “authenticity index.” Until then, users must remain diligent in checking both sets of data. The Turnitin color chart provides a necessary visual shorthand, but the complexity of human language and the nuances of academic research require a human touch to interpret correctly.
The primary takeaway for any user of the system is that the color is an indicator of overlap, not a measure of guilt. A red report can be legitimate, and a blue report can be problematic. By focusing on the quality of the matches and the context of the assignment, you can use the Turnitin platform to promote a culture of honesty and excellence in your academic community.
In summary, the Turnitin similarity report colors meaning is as follows: blue represents no matches, green is for minor overlap up to 24%, yellow indicates a medium level up to 49%, orange shows a high level up to 74%, and red marks extreme overlap up to 100%. Use these colors to guide your review, apply your filters to remove bibliographic noise, and always look for the story behind the highlights. This approach ensures that the technology serves the needs of education while protecting the standards of original research.
The transition toward automated detection has not replaced the need for good teaching. It has provided a way to identify patterns that were previously invisible. As a student, use the feedback from these reports to learn the difference between a good paraphrase and a poor one. As an instructor, use the reports to start conversations with your students about the value of their own unique perspectives. The colors are just the beginning of the diagnostic journey.
Final checks of the document should always involve looking at the “All Sources” tab to verify that no single source is contributing an excessive amount to the score. If you find that one specific paper or website accounts for 15% of your work, you likely need to rewrite those sections to avoid a charge of plagiarism, even if the overall icon is green. This level of detail is what separates a professional review from a casual glance. By mastering the Turnitin similarity report colors meaning, you empower yourself to navigate the complexities of modern academic writing with confidence and integrity.
The software serves a fundamental purpose in the preservation of academic value. In an era where information is abundant and easily copied, having a standard way to measure text similarity provides a level playing field for all students. Whether the report shows blue, green, yellow, orange, or red, the information it contains is a roadmap for improvement and a testament to the effort put into the writing process. Understanding these colors is the first step in ensuring your work meets the high standards required by your institution and your future professional career.
The nuances of the Turnitin plagiarism checker color code reflect the many different ways that text can be shared and reused. From the intentional copying of a peer’s work to the accidental omission of a citation in a bibliography, the system catches it all. By learning to read these reports accurately, you protect your academic reputation and contribute to a global community that values original thought and proper attribution. This detailed analysis of the similarity color chart and AI indicators provides the necessary knowledge to interpret your results with precision and fairness.
The ongoing development of detection algorithms will only increase the accuracy of these reports. As the database grows and the AI models become more adept at identifying non-human writing, the transparency of the academic process will improve. Stay informed about updates to your institution’s Turnitin settings, as changes in repository preferences or exclusion filters can shift your scores. By staying proactive and informed, you can make the most of these powerful integrity tools.
LET US HUMANIZE YOUR PAPERS – No Plagiarism Guarantee!
Need assistance with your writing? Look no further! Our team of skilled writers is prepared to provide you with prompt writing help. Rest assured, your work will be entirely original and free from any plagiarism, as we offer a guarantee against it. Experience swift and dependable writing assistance by reaching out to us today!
Top-Rated AI Text Humanizer | GET Flawless content for All Your PROJECTS!